Given a set of data, it is very useful to analyze the data in hopes of predicting future events, or at least predict the future as best as we can. This attempt at predicting future events involves an in depth look at the data and what is it exactly we want to determine. What has happened before in the past? Will future events follow the same or similar patterns?
For example, from a data set which includes $100$ previous trials, what do we think will occur on the 101st trial? Will it be the average of the first $100$ trials? Will it be, once again, the most common event that has occurred? Or, will it be no worse or no better then what occurred in the past $100$ trials?
These are all good questions to ask. It is impossible to predict with $100\%$ certainty what will occur on the next trial. However, with a little analysis, it will be surprising how close we can predict future events, depending upon how many times we have observed past events.
Some important measures of central tendency in the IB curriculum are: Mean, Median, Mode, Range, and Standard Deviation. The definition of each is given below.
Mean: The average of a set of data values.
Median: The middle value of the data set (when written from least to greatest)
Mode: The most common value that occurs.
Range: Largest Value – Smallest Value
Standard Deviation: On average, how much does a data value deviate from the average.
The formula to calculate standard deviation 𝜎, is as follows:
$\displaystyle\sigma = \sqrt{\frac{\sum(x−\mu)^2}{n}}$
where $x=$ a data value, $\mu=$ the mean (average), $n=$ the number of data values.
Variance: Standard Deviation squared or $\sigma^2$
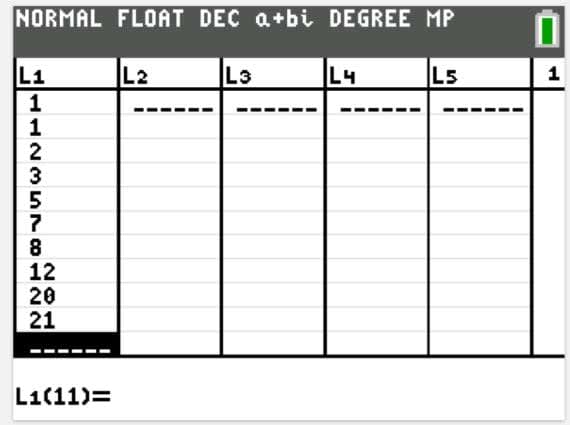
Example: Use technology to determine the mean and quartiles of the following data:
$\{1,1,2,3,5,7,8,12,20,21\}$
Listing these values in the STAT-EDIT option and STAT-CALC 1-Var Stats on the TI-84 graphing calculator gives:
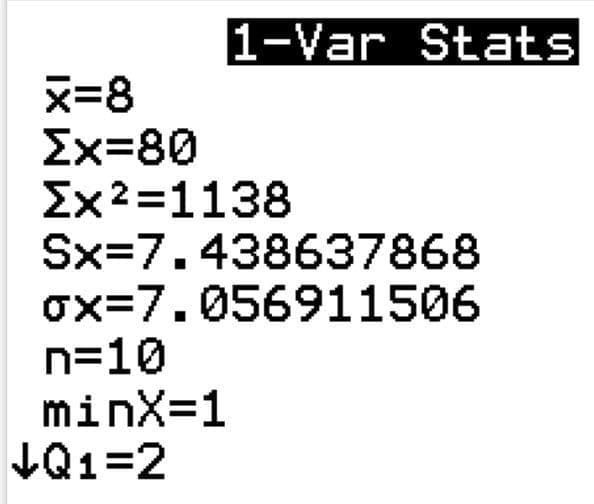
Thus the mean is $\bar x=8$, $Q_1=2$, $Q_2=6$, and $Q_3=12$. Therefore, the mean is $8$, $75\%$ of the data is above $2$, $50\%$ of the data (or median) is above $6$, and $25\%$ of the data is above $12$.