Graphs are a visual representation of trends in data.
- Graphical techniques are an effective means of communicating the effect of an independent variable on a dependent variable and can lead to determination of physical quantities.
- The independent variable is the cause and is plotted on the horizontal axis. The dependent variable is the effect and is plotted on the vertical axis.
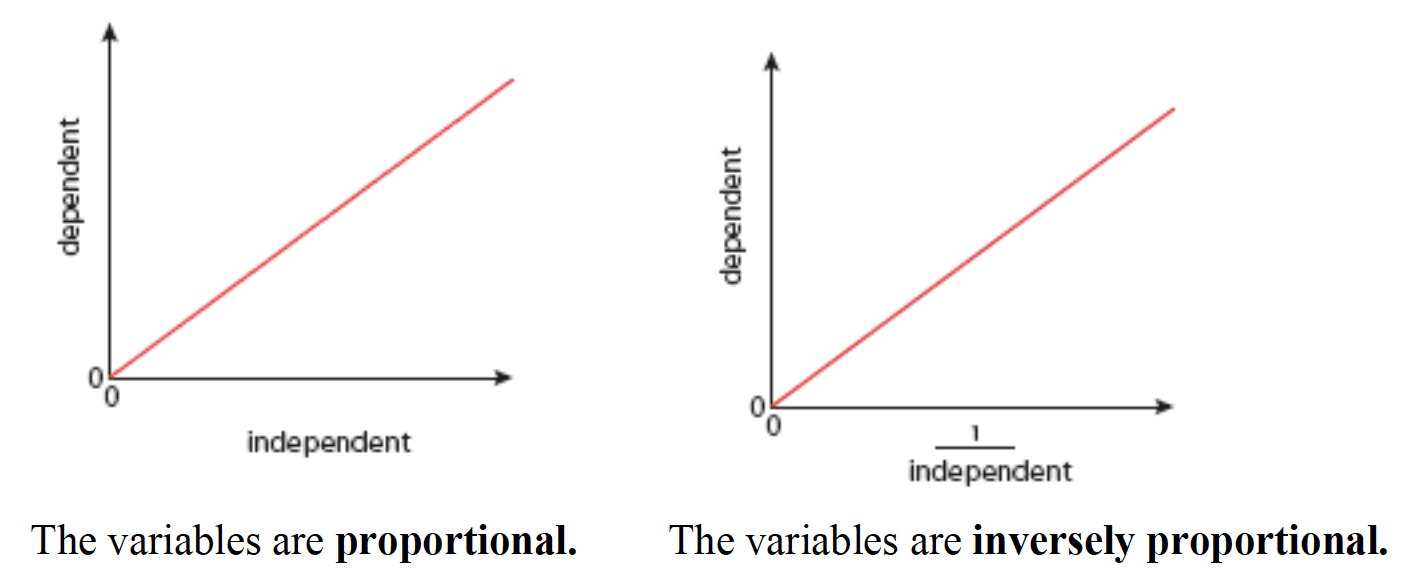
- Sketched graphs have labelled but unscaled axes, and are used to show qualitative trends, such as variables that are proportional or inversely proportional.
- Drawn graphs have labelled and scaled axes and are used in quantitative measurements.
- When drawing graphs:
- Give the graph a title (always based on y versus $x$), and label the axis with both quantities and units.
- Use the available space as effectively as possible and use sensible scales – there should be no uneven jumps.
- Plot all the points correctly.
- Identify any points which do not agree with the general trend.
- Think carefully about the inclusion of the origin. The point $(0, 0)$ can be the most accurate data point or it can be irrelevant.
- You should be able to give a qualitative physical interpretation of a particular graph.
- A ‘best-fit’ straight line does not have to go through all the points but should show the overall trend.
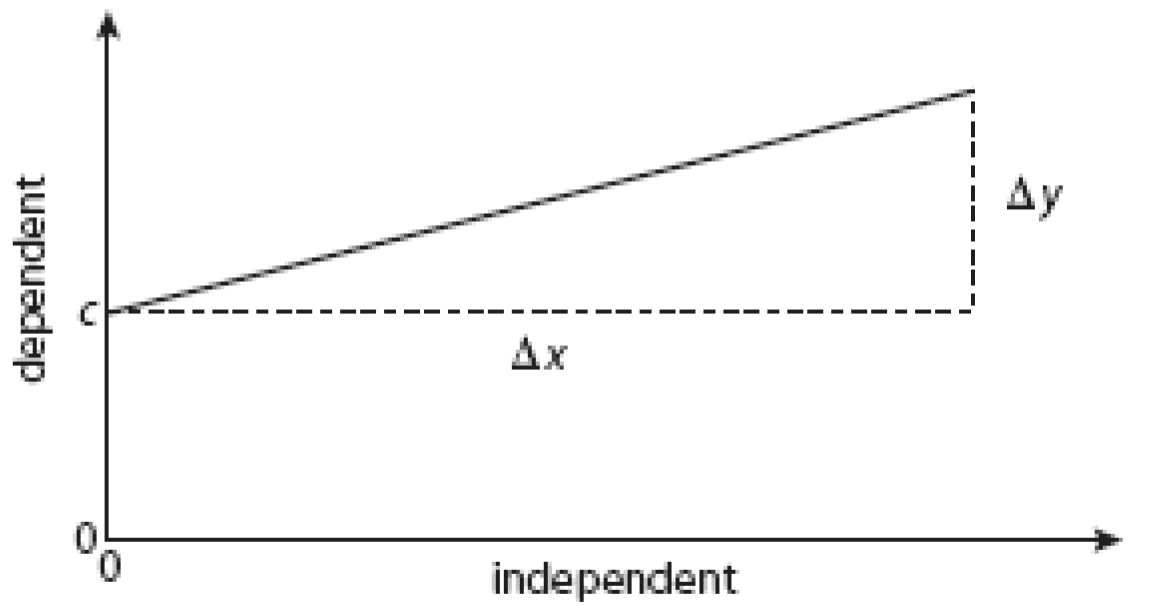
- The equation for a straight line is:
$y = mx + c$.
$x$ is the independent variable,
$y$ is the dependent variable,
$m$ is the gradient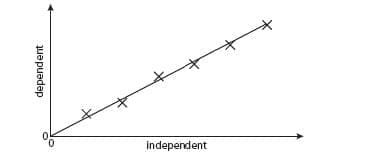
- $m = \Delta y/\Delta x$
$m$ has units of $y /x$ - c is the intercept on the vertical axis and has the units of $y$.
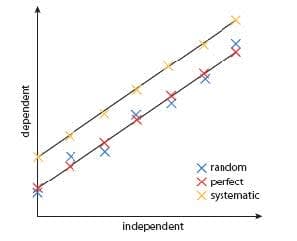
- A systematic error produces a displaced line.
- Random uncertainties lead to points on both sides of the perfect line.
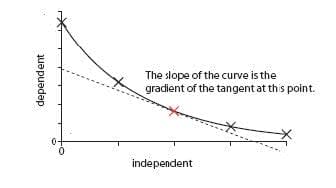
- The gradient of a curve is given by the gradient of the tangent at that point.
- The process of assuming that the trend line applies between two points is called interpolation.
- A line is extrapolated when it is extended beyond the range of measurement.