The greater the probability that molecules collide with sufficient energy and correct orientation, the greater the rate of reaction.
Monitoring the rate of reaction
![]()
Units of rate of reaction $\rm = mol~dm^{–3}~ time^{–1}$
$\rm e.g.$, $\rm mol~dm^{–3}~s^{–1}$, $\rm mol~dm^{–3}~min^{–1}$, or $\rm mol~dm^{–3}~h^{–1}$.
- Instantaneous rate of reaction at time $\rm t =$ gradient of tangent to curve of $\rm [R]$ or $\rm [P]$ vs time, at time $\rm t$.
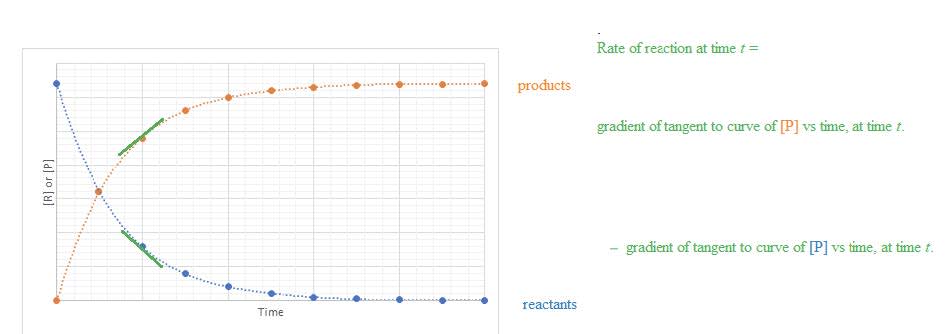
- Concentration changes in a reaction can be followed indirectly by measuring changes that occur during a reaction such as mass, volume, or absorbance of coloured light.
Worked Example
A student investigated the rate of reaction when large pieces of calcium carbonate are added to $\rm 30.0~cm^3$ of $\rm 1.0~mol~dm^{–3}$ hydrochloric acid.
$\rm CaCO_3(s) + 2 HCl(aq)$ $\rm \rightarrow CaCl_2(aq) + H_2O(l) + CO_2(g)$
Some of the data collected is shown.
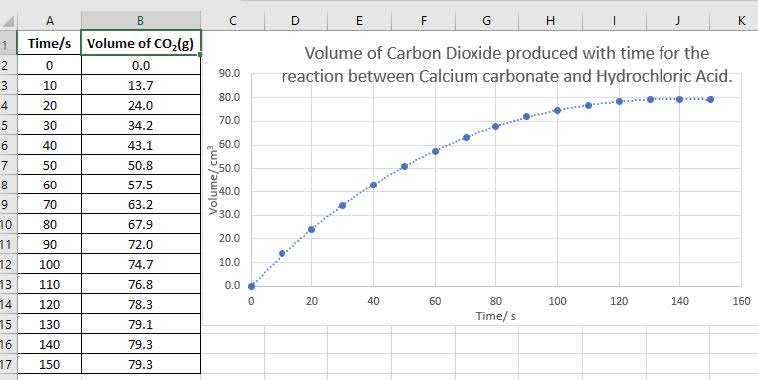
- Calculate the average rate of the reaction using this data for the first $\rm 10~s$.
$\scriptstyle \text{Average rate of reaction} ~=~ \frac{\text{increase in volume of carbon dioxide}}{\text{time taken}}$ $\rm = \dfrac{13.7}{10} = 1.4~cm^3~s^{-1}$ - Calculate the average rate of reaction in the interval $\rm 120 - 130~s$
$\scriptstyle\text{Average rate of reaction}~ =~ \frac{\text{increase in volume of carbon dioxide}}{\text{time taken}}$ $\rm = \dfrac{0.80}{10} = 0.80~cm^3~s^{-1}$ - Comment on the difference between these values.
The rate of reactions slows down as the concentration of reactants decreases. - Suggest other ways in which the rate of this reaction could have been monitored.
The mass decrease as the carbon dioxide escapes
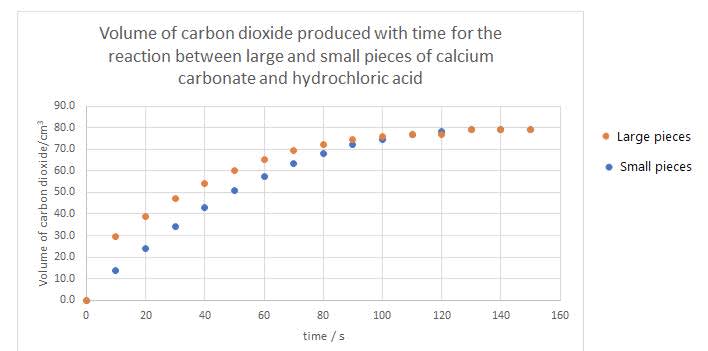
The concentrations of the acid as it decreases. - The experiment was repeated for the same quantities of chemicals but with smaller pieces of calcium carbonate. Sketch a graph showing the results of both experiments.
Curve is steeper.
Final volume is the same.
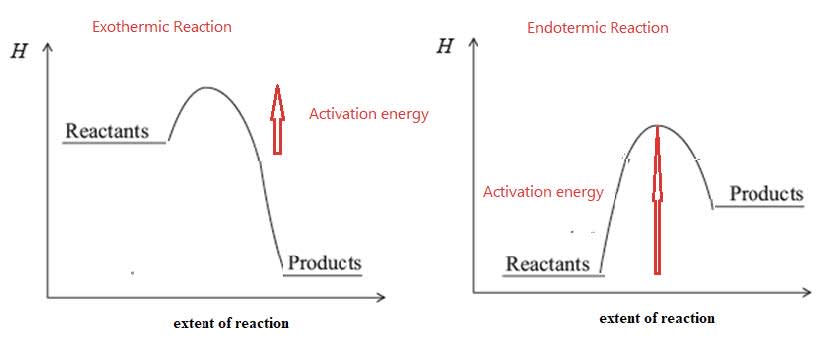
Collision Theory
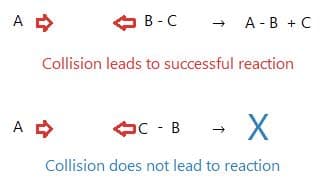
- Collisions between reactant particles will lead to reaction when:
- the particles have kinetic energy $\rm > Ea$ and
- the particles have the correct collision geometry.
- Absolute temperature is a measure of average kinetic energy.
- Activation energy, $\bf Ea$, is the minimum kinetic energy particles must have in order to react.
- Reaction rates are increased by an increase in concentration and surface area of reactants which all increase the frequency of collisions between reactants. An increase in pressure increases the rate of gaseous reactions.
- Reaction rates decrease during a reaction as the concentration of the reactants decrease.
The Maxwell–Boltzmann distribution
- The Maxwell–Boltzmann distribution shows the number of particles in a sample at different values of kinetic energy.
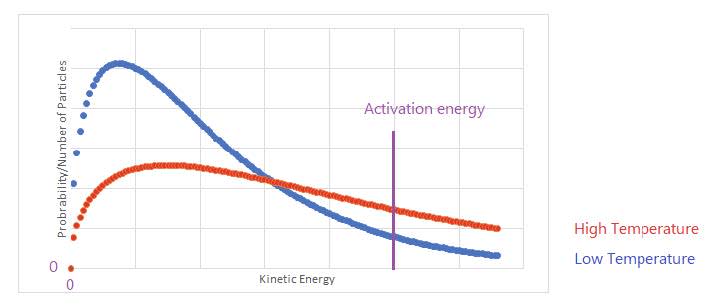
- The total area under the curve represents the number of particles or $1$ if the axis is fraction of particles.
- The curve begins at the origin for all temperatures. The peak for higher temperature is lower and lies to the right of that for lower temperature. The total area does change with temperature so as the range of kinetic energies increases the peak needs to decreases.
- The increase of rate with temperature can be explained by two factors:
- At higher temperatures particles move faster and collide more frequently.
- The proportion of particles with $\rm E_{kinetic} \geq E_{activation}$.
This the proportion of collisions which are successful increases with temperature. This is the most significant factor.
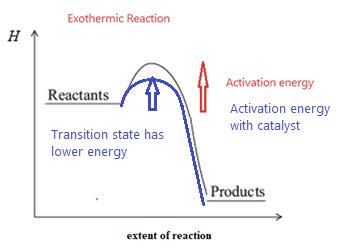
Action of Catalysts
- Catalysts speed up reactions by providing an alternate reaction route with a lower activation energy. More particles then possess the necessary reaction for reaction. A catalyst does not affect the average kinetic energy or the Maxwell Boltzmann distribution.
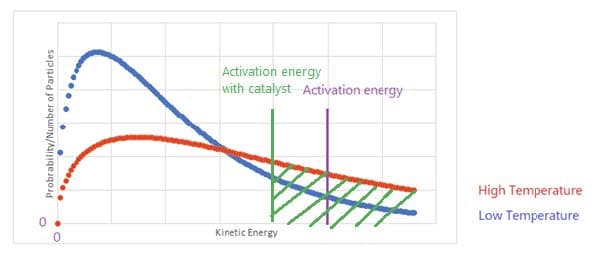
- Catalysts are not chemically changed by the reaction. They form a transition state of lower energy than the uncatalyzed reaction.
- Enzymes are biological catalysts.